David Nagy is an entrepreneur and online marketer with many e-commerce successes under his belt, including eCommerce Canada, EcoDiva Beauty and Live Out There. He’s developed solutions for brands like Virgin Mobile, GM and HBO.
There’s a lot of great advice out there on how to run a successful e-commerce site. One key aspect, that isn’t often brought up, is the importance of tracking and measuring the six key performance indicators (KPIs) of revenue and profit – especially when it comes to long-term success.
The typical e-commerce retailer manages product sourcing, marketing, site creation and maintenance, packing, shipping, accounting and returns – and that’s just the start of the list! So it’s easy to understand why some business owners aren’t keen to add more to the pile.
My first online store, the one that first taught me just how important it is to track these KPIs, was founded in my love the outdoors. An ongoing search for better equipment (ever been on a two-day hike in bad boots?) inspired Live Out There, an online store specializing in high-quality outdoor gear. In the ten years since then, I’ve been involved in over a dozen e-commerce ventures. Some succeeded, some did not.
One of the strongest takeaways from building successful online stores? The conviction that every e-commerce business owner should understand how to use measures to calculate the metrics that track the performance of their online store.
- A measure is something that can be, well, measured. Like a person’s height, how often they worked out last week, or the number of unique visitors to an e-commerce site on Tuesdays.
- A metric is created when we multiply or divide two or more measures. It reveals how these numbers relate to aspects of business. Like how many unique visitors make a purchase, for example.
These days just about any online behaviour can be measured with free tools like Google Analytics. But not all measurements are valuable when it comes to making business decisions. So, what measures and metrics should an entrepreneur monitor to grow a healthy e-commerce business?
Every business measures revenue (sales) on a regular basis. Most businesses break it down a bit further and know how many individual orders created that revenue. But it’s not possible to predict how a business will behave by looking at individual sales.
To identify the triggers that can be played with to increase revenue, businesses need look at the measures and metrics that are most tied to revenue. I keep a very close eye on these three:
- Sessions. This tracks the number of individual browsing visits per day.
- Conversion Rate. This measures the ratio between visits to your site and actual orders.
- Average Order Value (AOV). The “basket size”, or daily sales divided by the number of orders.
Sessions
Most e-commerce business owners are already familiar with terms like visits, hits or traffic. “Sessions” is the word used by search giant Google to show the volume of visitors (potential customers) on an e-commerce site. This measure also reveals whether visits are trending up, down or remaining stable.
They are the easiest measure to change through marketing. When a pay per click Facebook or Instagram campaign is turned on, or when a postcard drop that targets people similar to your best customers hits the mailbox – you should see the number of sessions go up almost immediately. Which means that your sales should go up, too.
Conversion rate
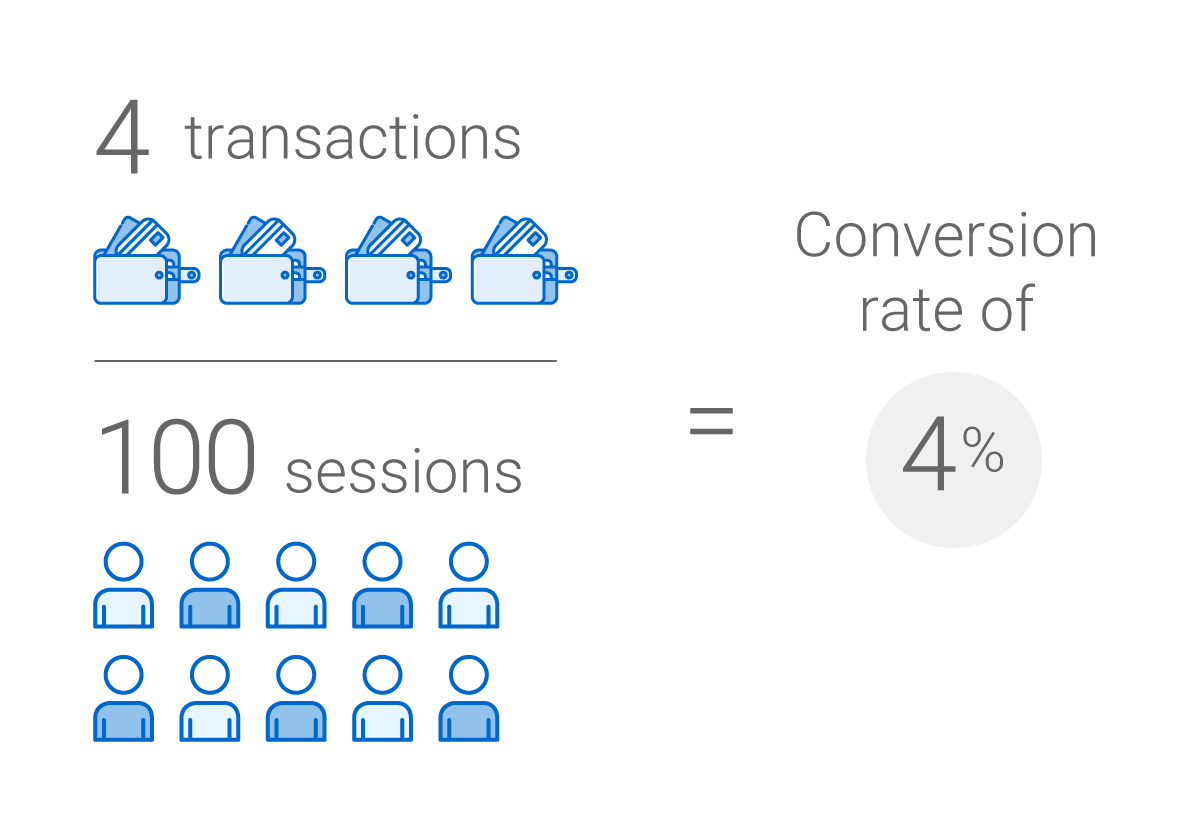
The conversion rate tells you how many of the visitors to your e-commerce site are making a purchase. To find out your conversion rate, divide the number of purchases by the number of sessions.

If you have a traditional retail business and are opening an e-commerce site, know that online conversion rates are much, much lower than in brick and mortar retail! To put it into perspective, four per cent is considered a strong conversion rate in online retail – and, in my experience, 1.5 per cent is a normal online conversion rate.
My best tip to improve your conversion rate? Clarity. Tell people exactly what you sell and make sure that it’s front and center on each page of your website. It works.
I recently featured an “On sale” collection for my organic beauty goods e-commerce site. The sale was the first thing you saw on the store’s landing page. I also did paid social marketing on Facebook and Instagram. During the 10 days I ran the promotion, sales on these products tripled! As soon as I stopped the paid social and removed the “On sale” banner, the increased sales all but vanished.
People have a short attention span. We have to be clear about what we are offering to them.
Average order value
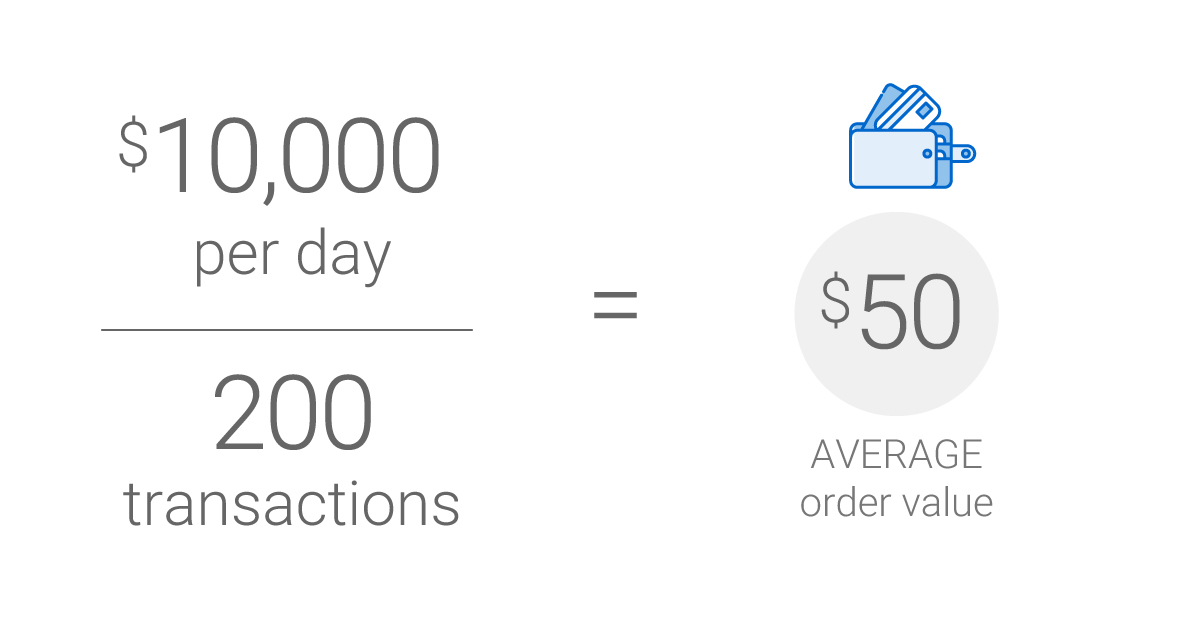
Staying on top of revenue means tracking the average dollar value of each transaction on your e-commerce site. You find this by dividing the total sales by the number of individual “basket” purchases in a given period.
For example, if you sell $10,000 in total per day and have 200 transactions, then your average order value is $50.

To make things easier, I include shipping and taxes when I’m tracking my average order value (AOV). They aren’t really revenue, so it’s an inflated number, but it gives me a quick and dirty way to see how my online store is doing before I get the formal book-keeping results.
Moving the AOV higher can be a challenge. Offering high-profit margin accessories is one way to up your AOV. If your customer buys shoes, try to get them to add socks to the order, or shoe care products! Add free shipping at a certain price point and you’ll see your AOV go up, too.
Stay in the loop. Get the latest e-commerce tips, resources and news delivered right to your inbox.
Sign up nowDon’t let the numbers freak you out
A couple of days, or even weeks, of bad revenue measures and metrics aren’t the end of the world. It’s more important to look at trends over time and tweak your store’s strategy accordingly.
If you get your measures and metrics from different sources, you may see different numbers. And that’s okay, as long as they are more or less consistently related over time. For instance, you might find that your web hosting company regularly reports 15 per cent more sessions than Google Analytics.
Work smarter, not harder, with your revenue metrics
Let’s talk about how you can use this information to build a half-million per year company by making the biggest impact on revenue for the least amount of effort.
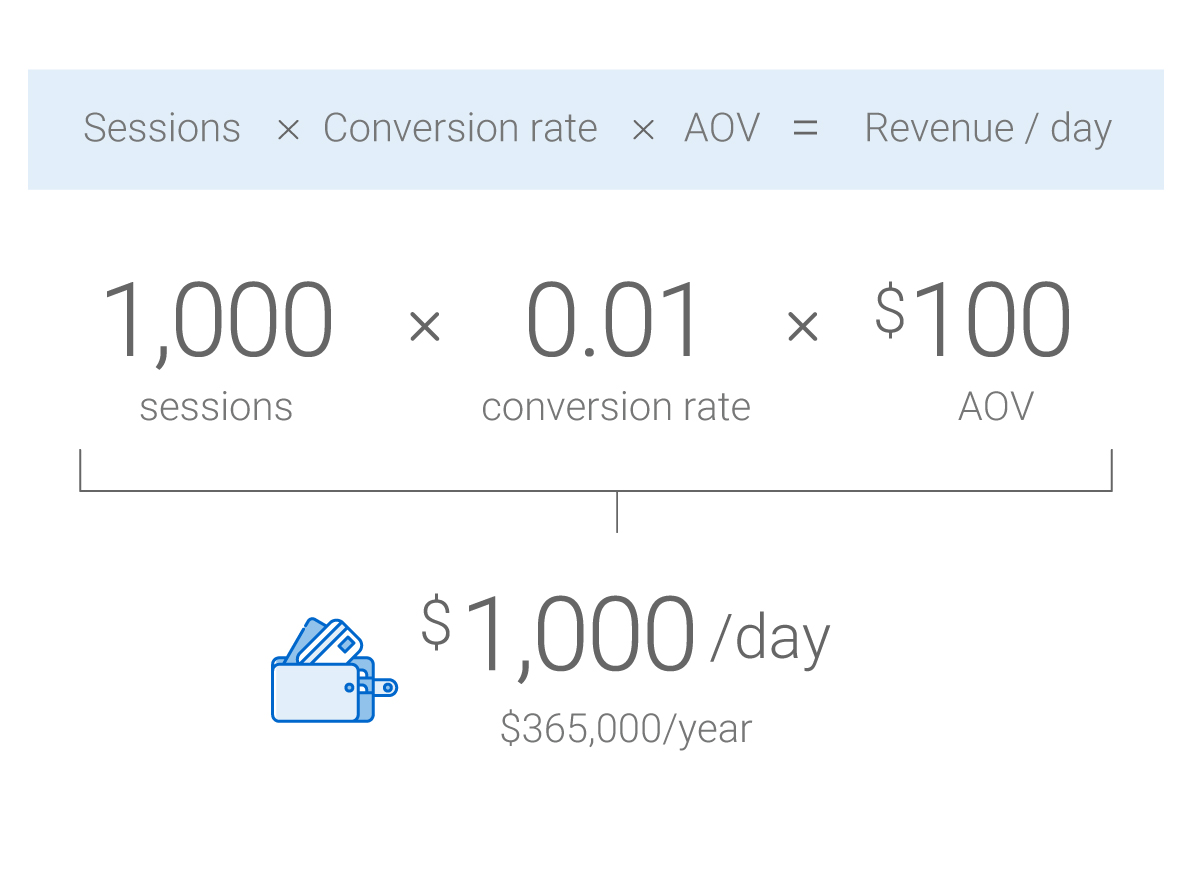
So, let’s say you are getting 1,000 Sessions per day. You have a Conversion Rate of 1 per cent and, on average, you sell $100 worth of product per transaction. Your formula looks like this:

These are nice numbers. But you can make them even better.
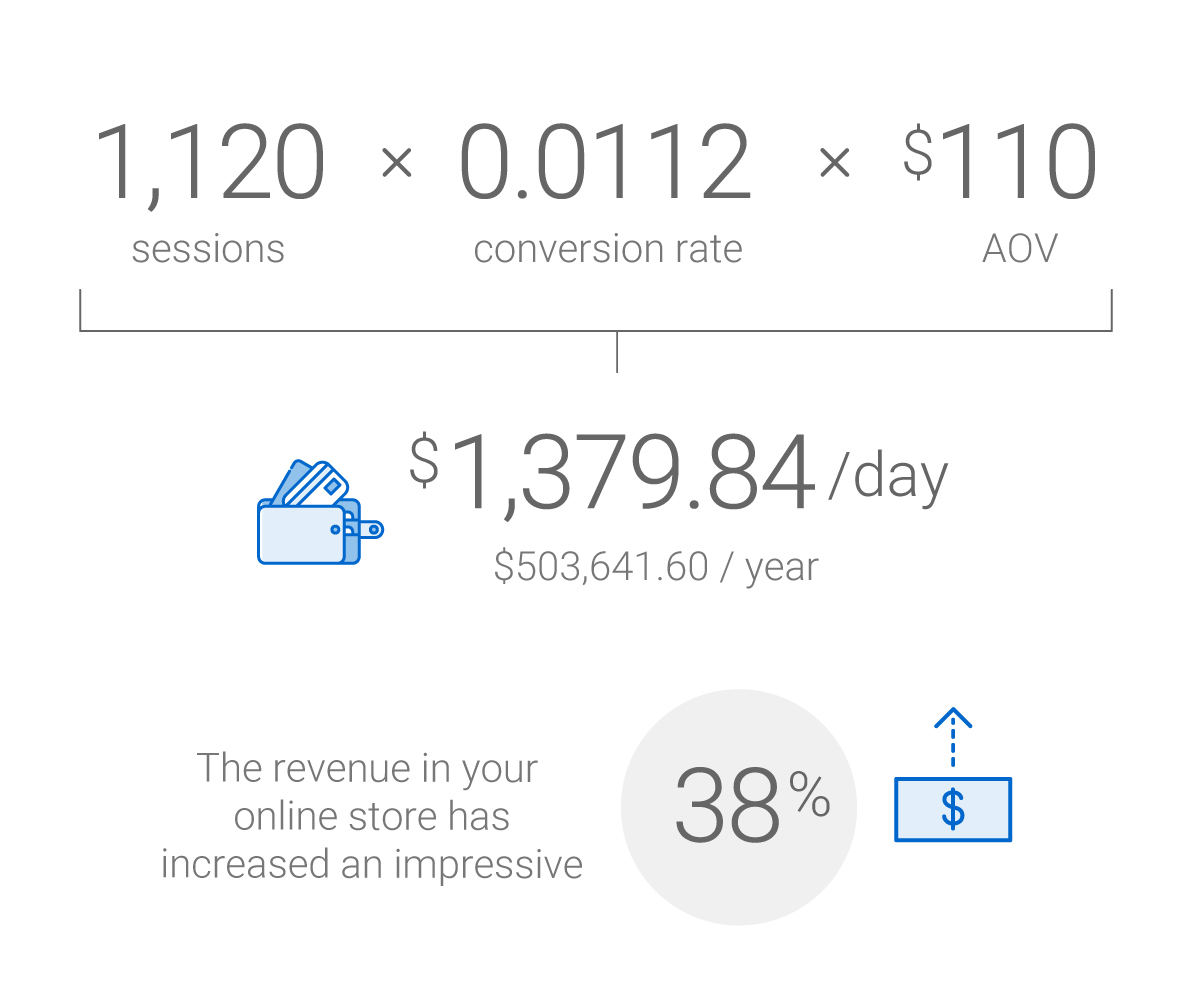
- Increase sessions. Target a reasonable 12 per cent increase with just a bit more effort on your site’s search engine optimization and by turning on a paid search program.
- Bump up conversion rates. Improve your site’s product photographs and descriptions for a quick increase in Conversion Rates to 1.12 per cent.
- Up the average order value. Implement a bundling program that can increase your AOV to $110. A free shipping breakpoint at $145, for example, could motivate every third or so customer to increase their order value enough to qualify for free shipping.
Now let’s take a look at what how these small increases add up over the year.

Take a moment to celebrate this victory!
In my businesses, I pay a lot of attention to the three revenue metrics I just outlined. I strongly encourage you to give it a try yourself. By monitoring and understanding these metrics, you’ll soon understand the best way to tweak them in your own business – and increase its revenue.
Read part 2: Track 3 profit indicators to grow your e-commerce store
Solutions that drive success
Discover our suite of end-to-end solutions that help drive business efficiency and satisfied customers.
Contact an expert